Torque by RaceProof

The shape of the heat

Loom didn't start with data. It started with a knitted scarf, a climate scientist's viral image, a print that hangs in my office, and the most important analysis model ever built for endurance sport.

Loom by RaceProof — training data rendered as colored vertical strips, each strip one ride
Loom by RaceProof. Each vertical strip is one ride. Color encodes energy system. Brightness encodes fitness. The pattern of a season, visible without reading a single number. How it works →

1

The Tempestry Project

I encountered a Tempestry Project installation and it changed how I thought about data visualization. Each knitted panel represents one year of daily temperature data for a single location. Rows of yarn colored to match the average daily temperature. Hung chronologically, the panels become a textile timeline of a changing climate.

Tempestry Project installation showing knitted panels representing years of temperature data
A Tempestry Project installation. Each panel encodes one year of daily temperature data as colored yarn. Self-contained individually, but gaining meaning from neighbors. The shape of the color gradient across the series carries information that no individual measurement can communicate. This is where Loom begins: each vertical panel is one unit of time, and the trend emerges from seeing them together.

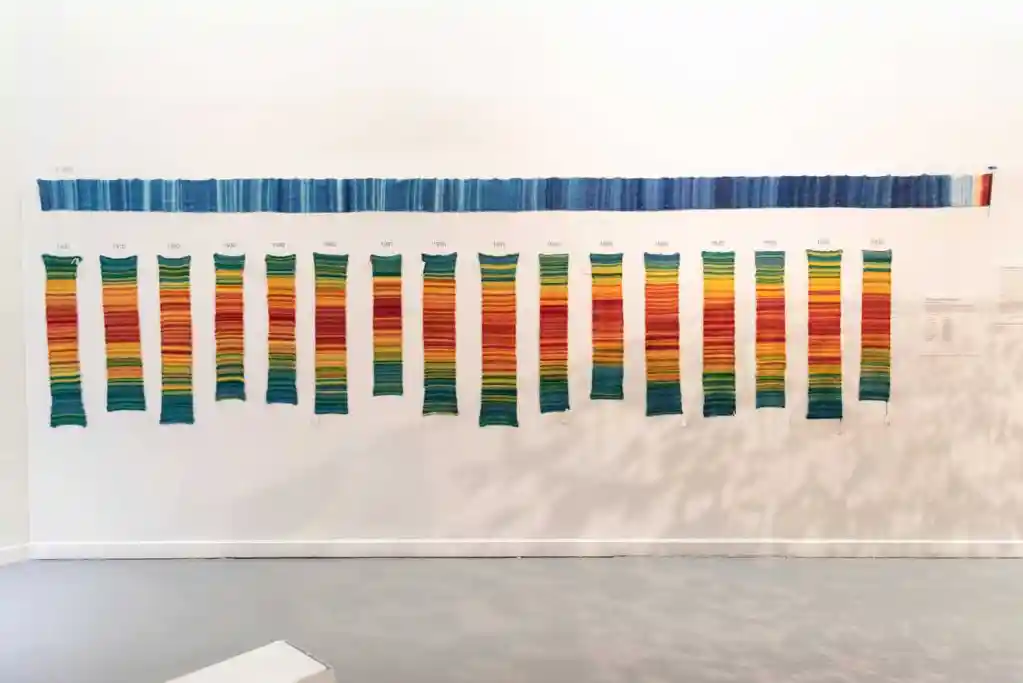
They weren't charts studied from a distance. They were objects at human scale, with physical weight and texture. Color gradients embedded in the material itself. The Tempestry Project was itself inspired by climate scientist Ed Hawkins' warming stripes.


2

Warming stripes

Ed Hawkins created the warming stripes in 2018 at the University of Reading. One vertical stripe per year. Color mapped to temperature. No axes, no labels, no gridlines. Just the data.

Ed Hawkins' warming stripes — global temperature change from 1850 to 2024, one vertical stripe per year colored from blue (cooler) to red (warmer)
Ed Hawkins' warming stripes, global temperature change 1850–2024. One stripe per year, color mapped to temperature anomaly. The left side is blue. The right side is red. The transition is undeniable. The visualization removes every barrier between the viewer and the pattern. It has since appeared on the covers of The Economist and Nature, been projected onto buildings, and worn by public figures. Its power comes from what it excludes.

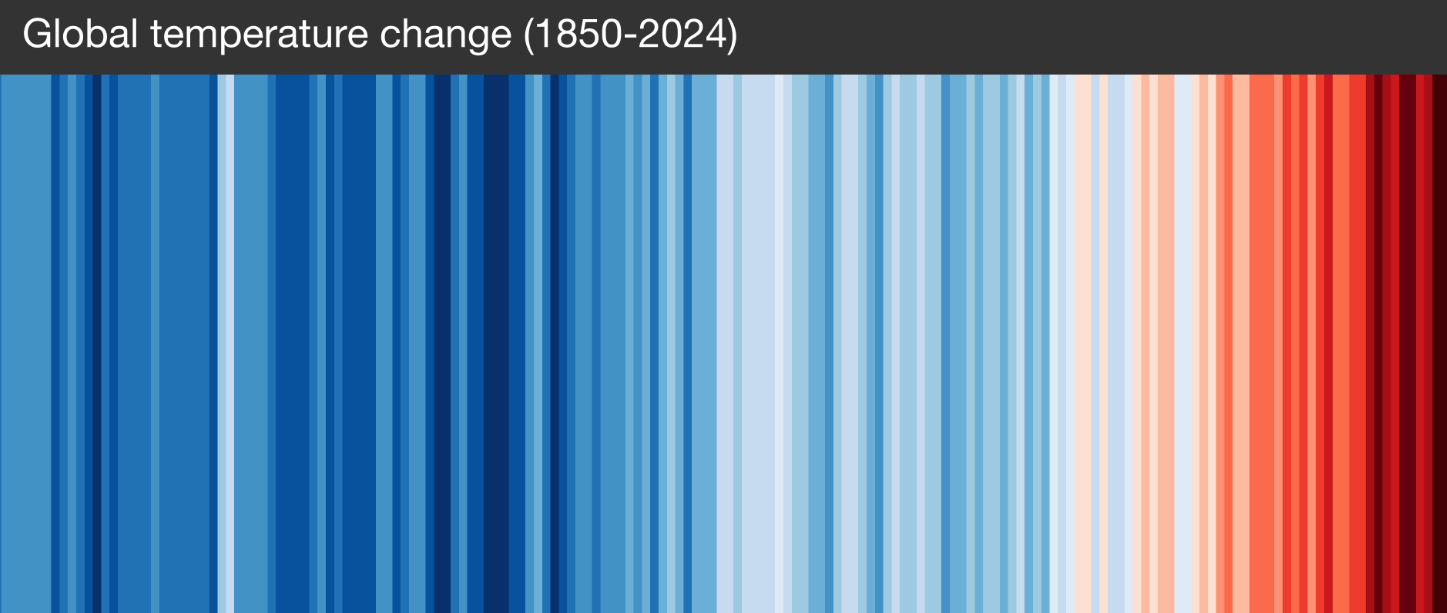
The principle underneath was one Tufte had articulated decades earlier: maximize the data-ink ratio. Every mark on the page should encode information. The warming stripes took that idea to its logical endpoint, an image that was nothing but data. Loom borrows this structure directly. One strip per ride. Color mapped to physiology.


3

Tufte / Tee-Shirts

Edward Tufte and Bonnie Scranton's Tee-Shirts print from Envisioning Information hangs in my office. I look at it every day.

Edward Tufte and Bonnie Scranton's Tee-Shirts print — a data visualization artwork that derives meaning entirely from color
Edward Tufte and Bonnie Scranton's Tee-Shirts from Envisioning Information. A data visualization artwork that derives meaning entirely from color, without words. Every hue is unique. No color is repeated anywhere in the entire chart. Read left to right, row by row, the palette shifts from bright to dark with interruptions along the way. Read top to bottom, a different interplay emerges. It functions like a key that unlocks challenges. I have faced problems so often that I've found can be clarified by looking up at this print and thinking in its terms.

What I value about it is not what it communicates. It is what it lets me bring to it. Data visualization holds truth. Art invites interpretation. The most powerful visualization gives the viewer a structure and gets out of the way. Loom inherits this principle directly.


4

Banister / Coggan / PMC

The physiological framework underneath Loom comes from two pioneers in exercise science.

TrainingPeaks Performance Management Chart showing CTL, ATL, TSB, and daily TSS
The Performance Management Chart. Fitness (blue, CTL) builds slowly and decays slowly. Fatigue (pink, ATL) builds quickly and decays quickly. Form (orange, TSB) is the balance between them. Eric Banister proposed the impulse-response model in 1975. Dr. Andrew Coggan translated it into TSS, CTL, ATL, and TSB. TrainingPeaks made it the lingua franca of endurance coaching.

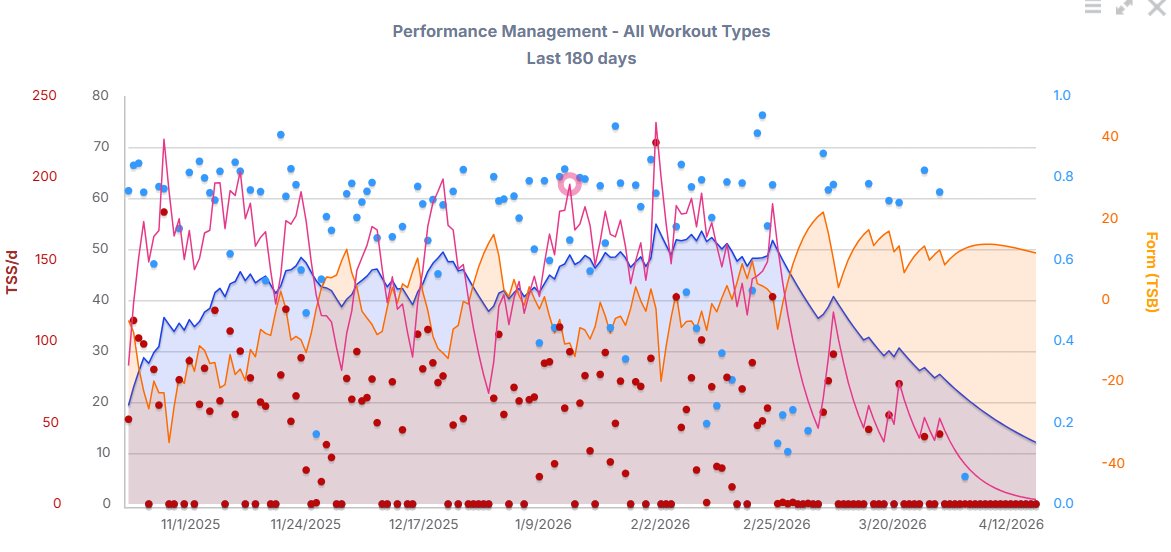
Loom re-encodes the PMC's line charts as properties of each strip. Brightness is fitness. A veil descends with fatigue and lifts with rest. The opposing forces that the PMC renders as converging and diverging lines become visible in the texture of the heat itself. The same physiological story, told in color and light rather than the distance between two lines.


Read next
Loom & Effort Signature documents the encoding, the Effort Signature fingerprint, the Seat concept, and three scales of application.
PTA Thesis defines the seven energy system thresholds underlying Loom's color spectrum.
The Racing Effect presents the population-level evidence behind competitive racing and fitness development.
Torque by RaceProof · PTA Methodology · RaceProof LLC