How textile art, Edward Tufte's principles of analytical design, and the climate science visualization that inspired them converged into Loom, a new way to see athletic development without reading a single number.
1. Introducing
Loom by RaceProof
Loom is a new way to see your athletic development. No numbers. No charts. Just the shape of your season, rendered as color and light.
Cyclists track fitness through abstraction: FTP, watts per kilogram, training stress scores. These metrics work, but they reduce months of effort to a spreadsheet. The Power Threshold Array gave us seven dimensions of fitness instead of one, making the data richer but the experience of reading it more clinical. We needed a way to make development visible at a glance, the way you can feel a season changing by stepping outside.
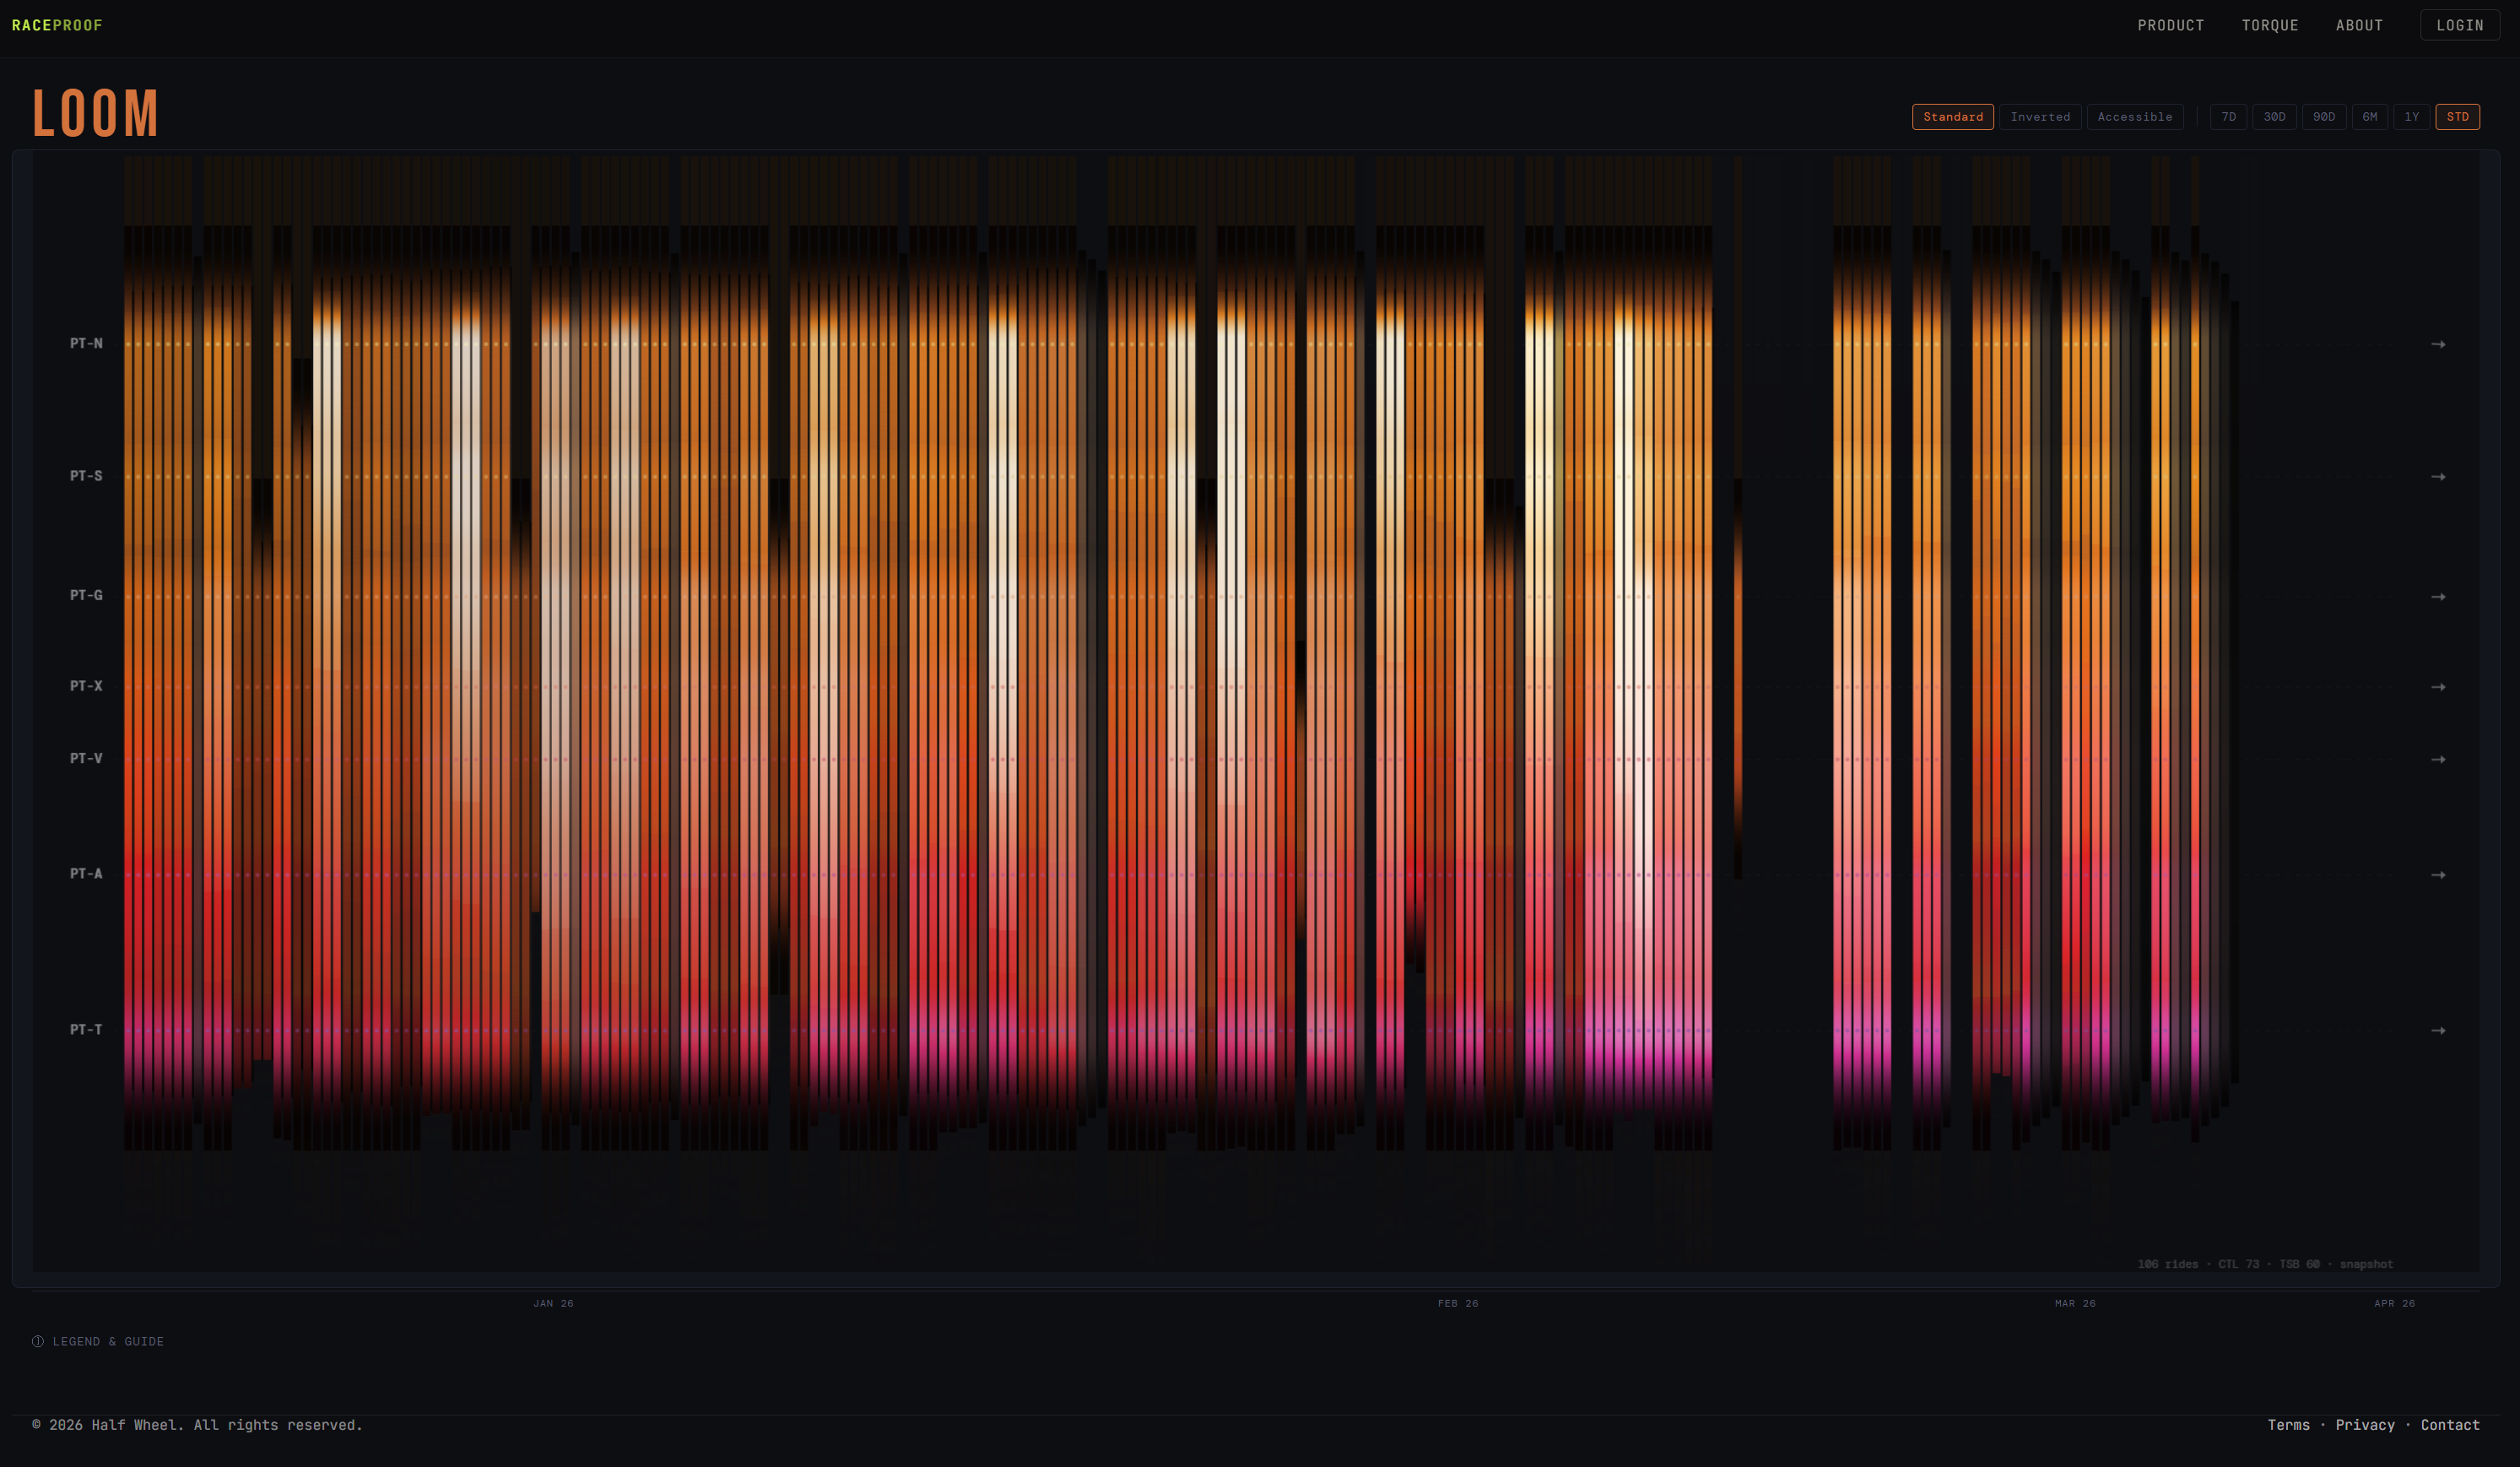
Loom is that. Every ride leaves a thread. Color encodes which energy systems you engaged. Brightness reflects your fitness. Sharpness shows freshness — blur means fatigue. Training echoes linger between rides. The threads weave together into a visible pattern, your season at a glance.
Loom by RaceProof. Each strip is one ride. The pattern of your development becomes visible without reading a single number.
The design draws from specific sources in climate science, textile art, and analytical design. This is the story of where Loom comes from.
2. Design influences
Four sources
Loom's design draws from four specific sources. Each validated a different decision in how the visualization encodes and presents athletic development data.
The Tempestry Project
Self-contained units, collective meaning
Knitted climate panels that turned data into objects at human scale. Each panel self-contained, gaining meaning from its neighbors — the principle at Loom's core.
Click to explore →
Ed Hawkins / Warming Stripes
Stripe-per-unit, pure data-ink
One stripe per year. No axes, no labels. The visualization that proved data could be its own decoration, inspiring the Tempestry Project and Loom's stripe-per-ride structure.
Click to explore →
Tufte / Tee-Shirts
Color as interpretive framework
A color-only data artwork that hangs in my office. It gives the viewer a structure and gets out of the way. Loom inherits this principle directly.
Click to explore →
Banister / Coggan / PMC
Opposing forces as visual texture
Fitness and fatigue as coupled, opposing forces — the physiological framework that Loom encodes as brightness, sharpness, and bleed in every strip.
Click to explore →
3. The encoding
What the heat means
Loom borrows the stripe-per-unit structure from warming stripes and applies it to athletic performance data. Each vertical strip represents one ride. The strips are arranged chronologically left to right. Within each strip, the vertical axis maps to the PTA spectrum, from neuromuscular power at the top (PT-N) to sustained threshold at the bottom (PT-T).
The encoding uses five visual channels, each carrying a different physiological signal:
Color
Energy system engaged. Sprint power burns gold at the top. Threshold effort glows deep plum at the bottom. The color tells you what kind of work was done.
Brightness
Fitness (CTL). Higher chronic training load produces brighter, more vivid strips. Low fitness dims the color. The power underneath.
Sharpness
Freshness — blur = fatigue. When you're fresh, the strip is crisp and defined. As fatigue accumulates, the image softens and blurs. After rest, sharpness returns.
Echoes
Training lingers between rides. The residue of yesterday's effort is visible in today's strip. Hard sessions cast a long shadow; easy ones fade quickly.
Bleed
No recovery between sessions. When fatigue erodes the boundary between rides, color bleeds across strips. Clean separation means the body is absorbing the work.
The PTA color scale runs from gold (PT-N, neuromuscular sprint) through orange and coral (PT-S, PT-G, PT-X, the glycolytic range) to deep plum and rose (PT-A, PT-T, aerobic capacity and threshold). The scale is designed so that the warmest colors correspond to the shortest, most explosive efforts and the deepest tones correspond to sustained endurance work.
PT-NPT-SPT-GPT-XPT-VPT-APT-T
The color assignments are deliberate. Sprint power at the top of the strip and the warm end of the spectrum mirrors the physical sensation: explosive, hot, fast-burning. Threshold power at the bottom and the cooler end of the spectrum reflects the deep, sustained burn of endurance work. The color maps to the physiology intuitively.
4. Reading it
Patterns, not numbers
A Loom rendering makes several things visible immediately without any numerical literacy:
Consistency. Dense, closely-spaced strips mean regular riding. Gaps in the sequence are visible as literal empty space. You can see a two-week break without counting days.
Fitness trajectory. A sequence that grows brighter over time is a rider building fitness. A sequence that dims is fitness eroding. The gradient tells the story.
Fatigue cycles. Blur accumulates over hard riding days, softening the sharpness of each strip. After rest, the image resolves back to clarity. Overtraining appears as sustained blur — the sharpness never returning.
Echoes. Yesterday's training is visible in today's strip. A hard interval session casts a long echo into the following day. Easy sessions fade quickly. The residue tells you how much the body is still processing.
Bleed. When color bleeds across strip boundaries, recovery isn't happening between sessions. Clean separation between strips means the body is absorbing the work. Sustained bleed is a warning sign.
Energy system development. A rider focusing on sprint work will show gold-dominant strips. A rider building their threshold will show deep plum developing at the base. Whole-curve development shows vivid color from top to bottom.
Peak form. The sharpest, most brilliant strips in the entire sequence are peak form: high fitness, low fatigue, full energy system engagement. You can locate your best days by finding the brightest, crispest threads in the weave.
5. Why this matters
The story is the shape
The title of this post comes from the tagline on the Loom visualization: the pattern of your development becomes visible, no numbers needed. The shape of the heat is the story.
Hawkins' warming stripes work because they make a planetary trend legible to anyone, regardless of their statistical literacy. The Tempestry Project works because it translates data into something you can hold and wear. Tufte's principles work because they insist that the data itself, not the decoration around it, is the content. Coggan's PMC works because it makes the invisible forces of fitness and fatigue visible as a single, readable shape.
Loom applies these ideas to individual athletic development. Every ride leaves a thread. The threads weave together into a visible pattern. The pattern tells you whether you're building, maintaining, or losing fitness across every energy system, without opening a spreadsheet or parsing a training load chart.
Every ride you do leaves a thread. Loom weaves them together.
Related
PTA Reference describes the Power Threshold Array methodology that defines the seven energy system thresholds (PT-N through PT-T) underlying the Loom color encoding. The Racing Effect presents the population-level evidence that competitive racing produces measurable fitness development at every PTA threshold.
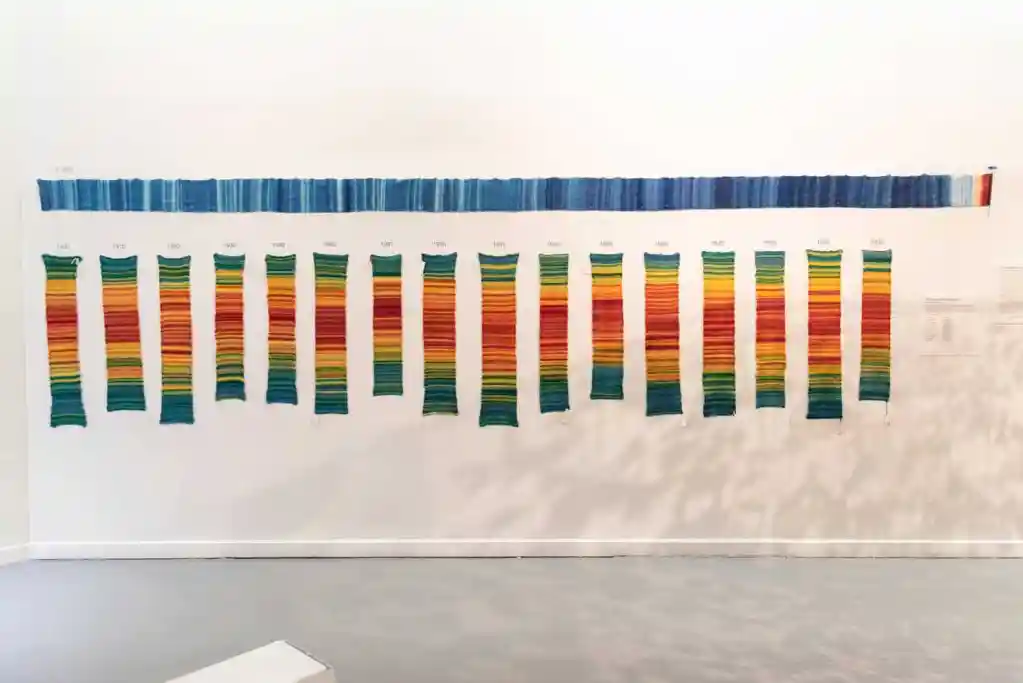
A Tempestry Project installation. Each knitted panel encodes one year of daily temperature data. Self-contained but gaining meaning from neighbors.
I encountered a Tempestry Project installation and it changed how I thought about data visualization. Each knitted panel represents one year of temperature data for a specific location, with each row of yarn colored to match the average daily temperature. Hung side by side in chronological order, the panels become a textile timeline, a woven record of a changing climate.
The scarves and panels weren't charts you studied from a distance. They were objects you stood next to, at human scale, with physical weight and texture. The color gradients weren't plotted on a coordinate system. They were embedded in the material itself. The medium was the message: climate change encoded as warmth, literally.
What stayed with me was the idea that each vertical panel was self-contained but gained meaning from its neighbors. One year's panel tells you about that year. Twenty panels together tell you about a trend. The shape of the color gradient across the series carries information that no individual measurement can communicate. This is where Loom begins.
The Tempestry Project was itself inspired by climate scientist Ed Hawkins' warming stripes, one of the most recognizable data visualizations in the world.
Warming stripes
The origin of the stripe
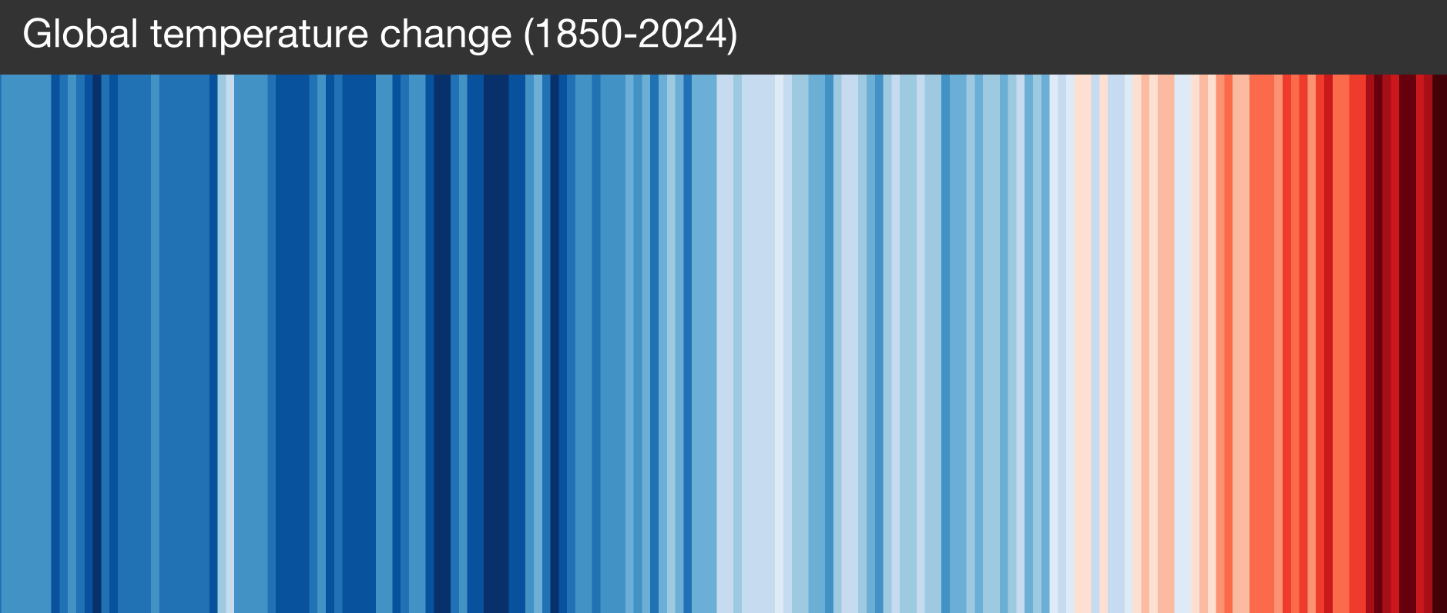
Ed Hawkins' warming stripes — global temperature change, 1850–2024. One stripe per year, color mapped to temperature anomaly. The pattern is the message. showyourstripes.info
The visualization that inspired the Tempestry Project was created in 2018 by climate scientist Ed Hawkins at the University of Reading. Hawkins stripped away everything except the signal. One vertical stripe per year. Color mapped to temperature. Blue for cold, red for warm. No axes, no labels, no gridlines. Just the data, rendered as a gradient that anyone could read without knowing what a temperature anomaly is.
Hawkins called them warming stripes. The visualization was immediately powerful because it removed every barrier between the viewer and the pattern. You didn't analyze it. You saw it. The left side was blue. The right side was red. The transition was undeniable.
The principle underneath was one Tufte had articulated decades earlier: maximize the data-ink ratio. Every mark on the page should encode information. The warming stripes took that idea to its logical endpoint, an image that was nothing but data.
Hawkins' warming stripes have since been adopted by media and institutions worldwide. The design has appeared on the covers of The Economist and Nature, been projected onto buildings, and worn by public figures. Its power comes from what it excludes.
Tufte's influence
A framework for interpretation
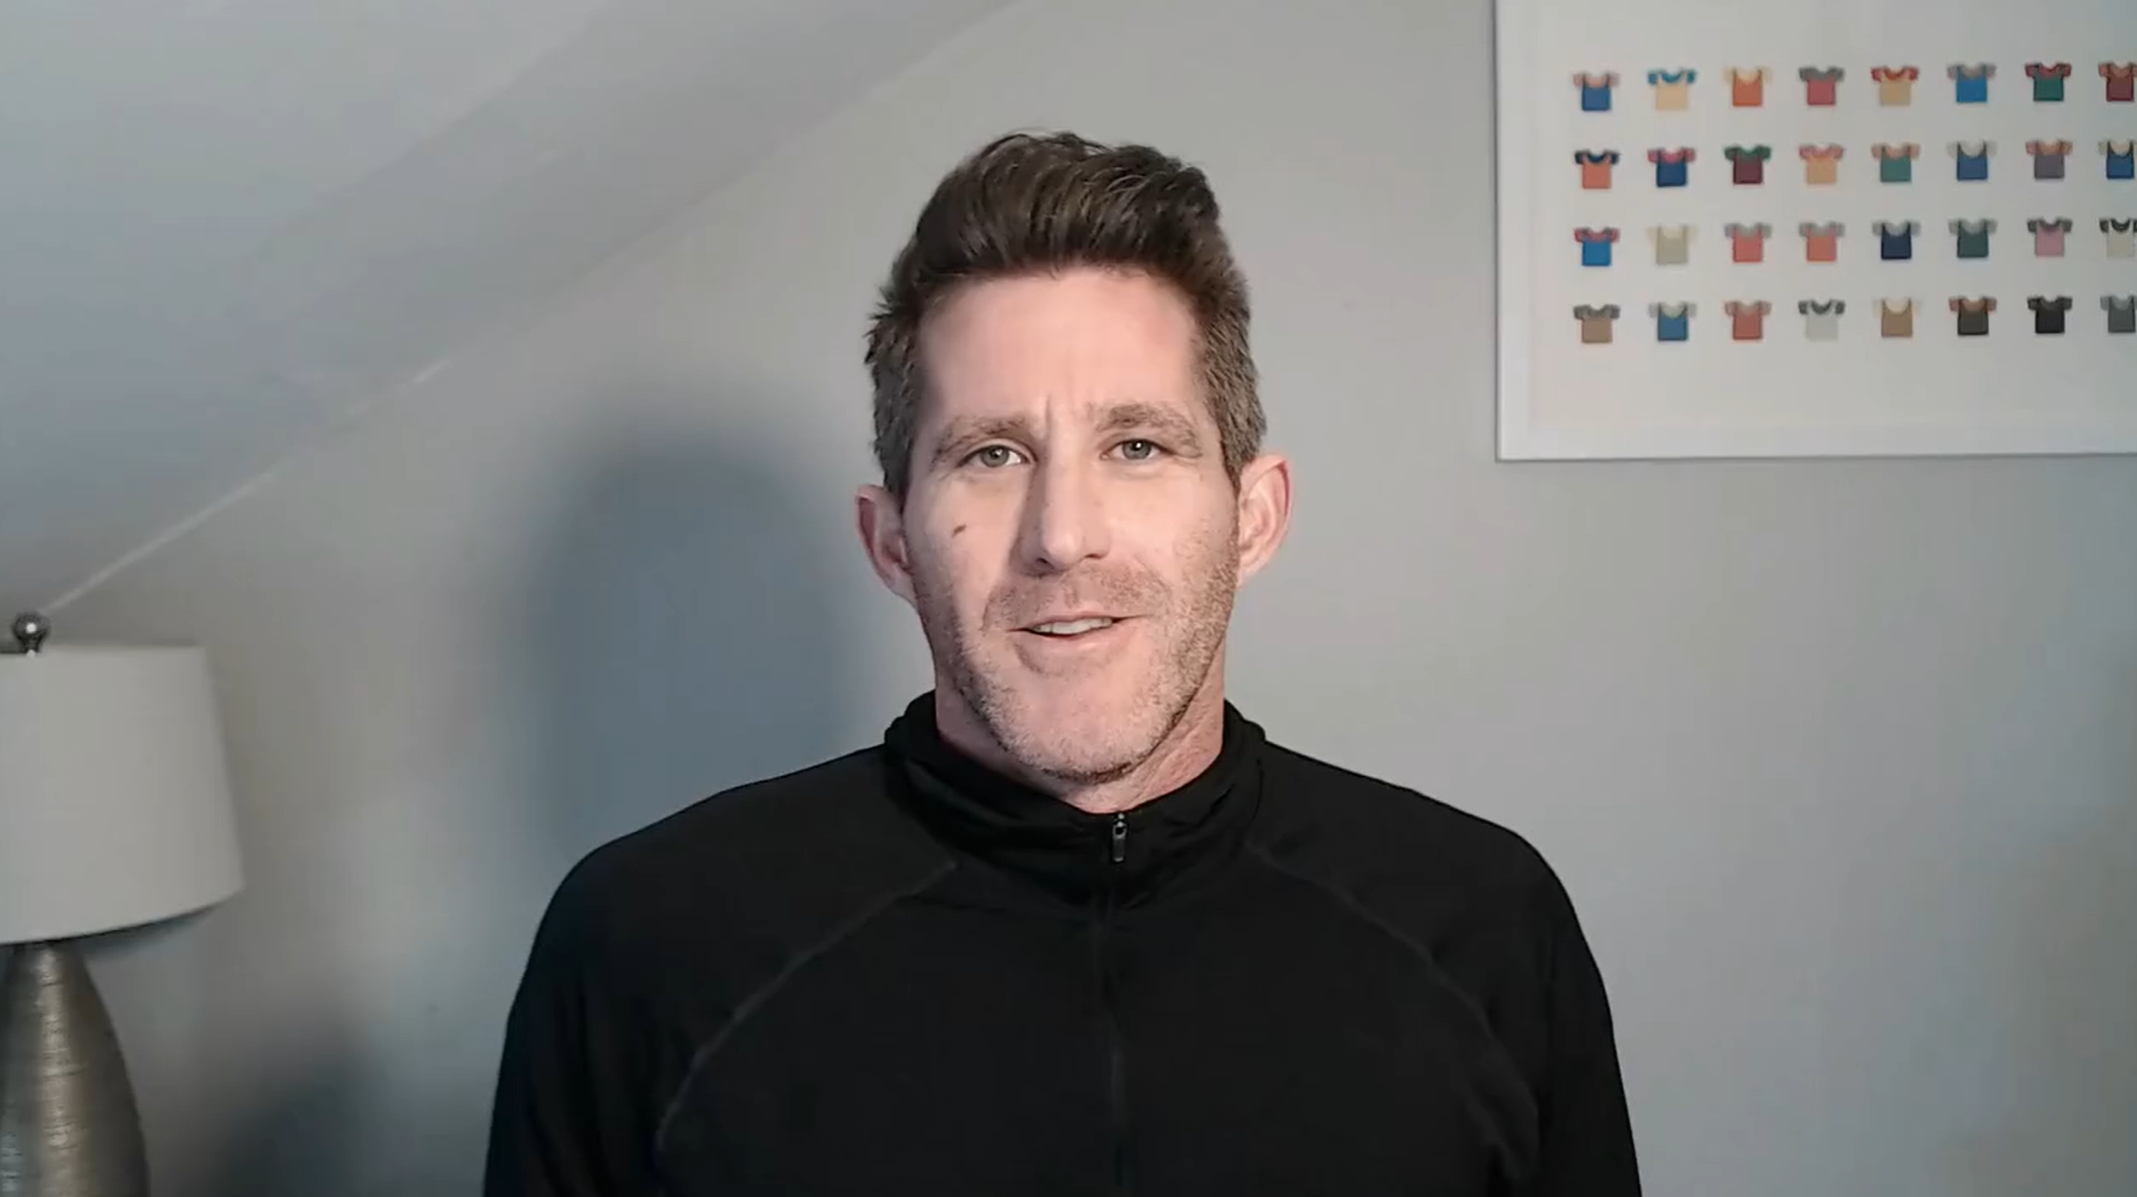
Edward Tufte and Bonnie Scranton's Tee-Shirts from Envisioning Information. A data visualization artwork that derives meaning entirely from color, without words.
Edward Tufte and Bonnie Scranton's Tee-Shirts print from Envisioning Information hangs in my office. I look at it every day.
The piece is a data visualization artwork that derives meaning entirely from color, without words. But what I value about it is not what it communicates. It is what it lets me bring to it.
Data visualization and art occupy different territory. Data holds truth and pragmatic meaning. Art involves interpretation. The viewer defines meaning, unique to themselves. Tee-Shirts lives in the space between. Its simplicity, the absence of words, lets me bring data to it. It functions like a key that unlocks challenges. I have faced problems so often that I've found can be clarified through the Tee-Shirts framework, by looking up at the print and thinking in its terms.
The structure rewards close reading. Contrasting colors within each individual shirt signify nuance, singular attention to each one. Every hue is unique. No color is repeated anywhere in the entire chart. And yet the interplay of all of them together creates a coherent whole. There is a gradient to it. Read left to right, row by row from the top, the palette subtly shifts from bright to dark, with moments that interrupt along the way, representing a non-linear trajectory through the gradient shift. Read in column form, top to bottom, a different interplay of color emerges. Each column is different. Each row is different. A structured data set in form only.
Tufte's broader body of work, the concepts of data-ink ratio, small multiples, graphical integrity, and the relentless elimination of chartjunk, form the philosophical foundation of how I approach visualization. But Tee-Shirts is the piece that sits in my peripheral vision while I work. The most powerful visualization gives the viewer a structure and gets out of the way. Loom inherits this principle. The heat is the data. The meaning is yours.
Banister / Coggan / PMC
The language of load
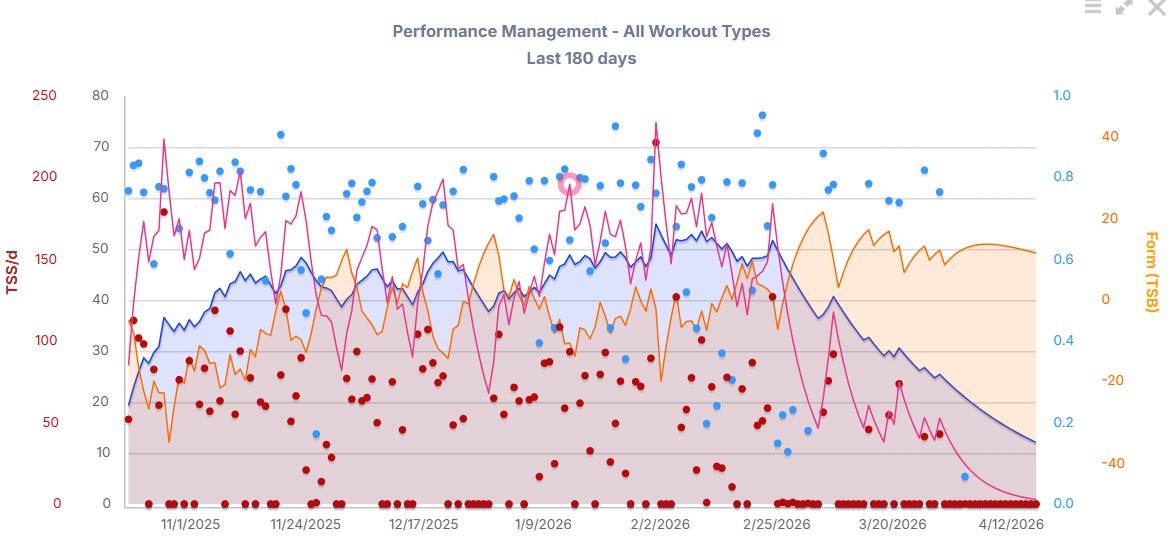
The Performance Management Chart. Fitness (blue, CTL), fatigue (pink, ATL), form (orange, TSB), daily training stress (dots). Symbiotic, opposing forces held in a single view.
The physiological framework underneath Loom comes from two pioneers in exercise science.
In 1975, Eric Banister proposed the impulse-response model of training: every session produces two competing biological responses. Fitness builds slowly and decays slowly. Fatigue builds quickly and decays quickly. Your readiness to perform on any given day is the balance between these two forces. You are always simultaneously getting stronger and getting more tired, and the interplay between the two determines everything.
Dr. Andrew Coggan translated Banister's model into metrics cyclists could track daily. Training Stress Score (TSS) quantifies the cost of each ride. Chronic Training Load (CTL) accumulates TSS over weeks, tracking the slow-building fitness response. Acute Training Load (ATL) tracks the fast-building fatigue response over days. Training Stress Balance (TSB) is the difference: positive means fresh, negative means fatigued.
TrainingPeaks implemented these as the Performance Management Chart, which became the lingua franca of endurance coaching. The PMC draws fitness and fatigue as two lines, intertwined and opposing, their convergence and divergence visible across months of training. When the lines pull apart, the athlete is either peaking or overtrained. When they converge, the athlete is either absorbing load well or undertrained. The space between the lines is the story.
Loom takes the PMC's line charts and re-encodes them as properties of each strip. Brightness is fitness. Sharpness is freshness — blur is fatigue. Echoes let the residue of training linger visibly between rides. Bleed reveals when recovery never comes. The opposing forces that the PMC renders as converging and diverging lines become visible in the texture of the heat itself. You see the same physiological story the PMC tells, but you see it in the color and light of each ride rather than in the distance between two lines.